Internet Bot Traffic Statistics: Good vs. Bad Bots Breakdown
Bots now make up about half of web traffic or more, depending on who is counting and what they count. Cloudflare Radar reported in June 2026 that automated requests were roughly 57% of HTML page requests worldwide. Imperva's 2026 Bad Bot Report put bots at over 53% of all web traffic in 2025.
The exact split matters less than the direction. Automation is growing faster than human browsing, and a growing share of it comes from AI crawlers and agents. This post lays out what the main sources actually measured, how good bots differ from bad ones, and what the shift means for your analytics and infrastructure bills.
How Much of the Web Is Bots?
Between 31% and 57%, depending on the source and the metric. The figures below measure different things, so they should not be mixed or averaged.
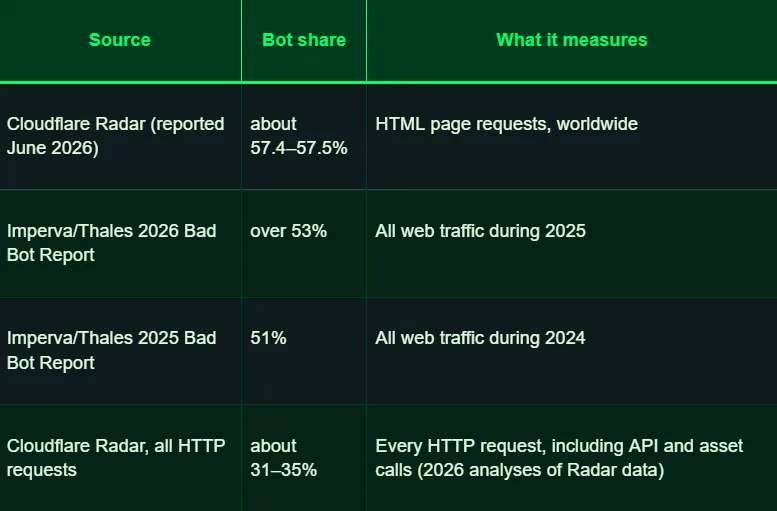
The gap between the first and last rows is a definition gap. HTML page requests are the closest proxy for "visits," while all HTTP requests include images, scripts and API calls, so the two measures count different things.
Two more caveats apply. Imperva and Cloudflare each measure only the traffic that crosses their own networks, and Imperva's report is published by a bot-mitigation vendor. Treat every figure as a well-sourced estimate, not a census.
Good Bots vs. Bad Bots
Imperva's 2026 report says 40% of bot traffic is malicious. On a 53% bot share, that works out to roughly 21% of all web traffic from bad bots and about 32% from good ones. The majority of automation is not hostile, but the hostile share is large.
Those are our calculations from the reported percentages, so check them against the full report before quoting them as Imperva's own split. For comparison, Imperva's 2025 report found 37% of all web traffic came from bad bots and 14% from good ones.
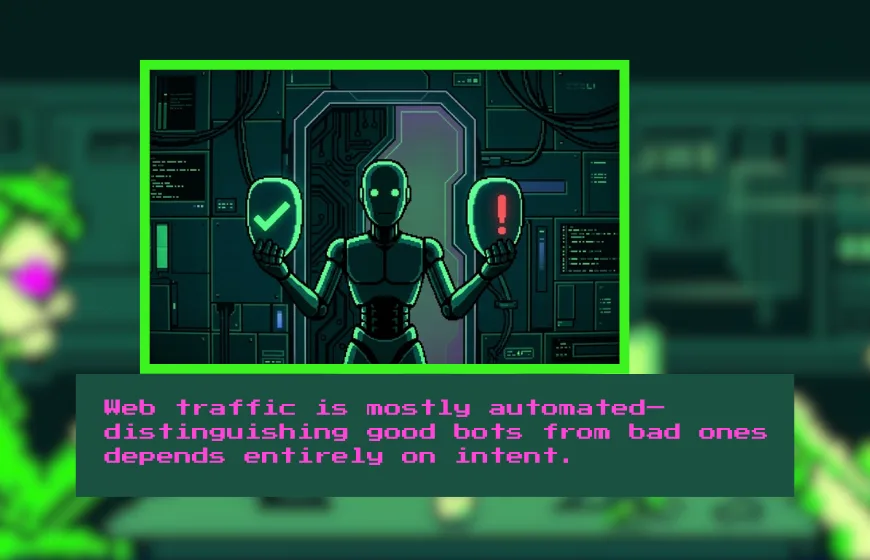
Good bots follow site rules and serve a useful function:
- Search engine crawlers such as Googlebot and Bingbot
- Uptime and performance monitors
- Accessibility, translation and archiving tools
- AI crawlers that respect robots.txt and published crawl policies
Bad bots are built to abuse a site:
- Credential stuffing: mass login attempts with stolen passwords
- Scraping: bulk extraction of pricing, content or user data, often ignoring site policies
- DDoS: floods of requests meant to cause downtime
- Fake account creation, carding and other fraud
The line is blurrier than it used to be. A crawler that identifies itself honestly can still strain a small site, and some AI scrapers hide behind browser-like user agents. Vendors also classify bots differently, which is another reason their ratios do not match.
The Rise of AI Crawlers and Agents
HUMAN Security's 2026 State of AI Traffic report found that automated traffic grew about eight times faster than human traffic in 2025. The report draws on more than one quadrillion interactions seen across HUMAN's customer base. Within that automation, AI-driven traffic was the main growth engine:
- AI-driven traffic grew 187% from January to December 2025.
- Traffic from AI agents and agentic browsers grew 7,851% year over year.
- AI scraper traffic grew 597% over the same period.
- Training crawlers were still the largest AI category, at 67.5% of AI-driven traffic, though their share fell during the year.
- Scraping attempts approached 20% of all site visits across HUMAN's customers.
Two details are easy to get wrong. The eight-times figure covers all automated traffic, not only AI traffic. And the 7,851% is a growth rate, not a share of traffic, so it shows how fast agents are arriving, not how much of the web they make up.
Agentic traffic is also the most interesting category because it acts on behalf of a person. According to HUMAN, product and search pages drew 77% of agentic activity and 2.3% occurred on checkout pages, which means some agents are already completing purchases without a human clicking.
What It Means for Analytics and Costs
If you read raw traffic numbers as human attention, you are likely overstating it. Bots can inflate pageviews, skew bounce rates and sessions, and trigger marketing automation that was meant for real prospects.
Imperva's 2025 report found the effect is uneven by industry. As summarized by TechRadar, bad bots made up 41% of travel traffic and 59% of retail traffic. Sites in those sectors have the most to lose from distorted data and fraud.
Bots also cost money. Every automated request uses bandwidth, CDN capacity and server time, and sudden surges can slow a site or take it down. Publishers have a further problem: AI systems can read and summarize content without sending readers back, which weakens the ad and subscription models that depend on visits.
What to Do About It
Start by separating bot traffic from human traffic wherever you report numbers.
- Segment your analytics. Exclude known bots, and compare the filtered and unfiltered views before reporting engagement.
- Check your server or CDN logs for crawl spikes, and watch for traffic that claims to be a browser but behaves like a script.
- Decide which crawlers you want. Set robots.txt rules for the ones that respect them, and use a CDN or WAF to challenge or block the ones that do not.
- Look at the controls your CDN offers for AI access. Cloudflare, for example, has shipped AI Crawl Control and a pay-per-crawl option.
- Track bot-driven bandwidth and compute as its own line in your cloud bill, so cost surges are visible.
Bots are now a major part of the web, but a bot is not automatically a threat. The useful question is which automation helps you, which hurts you, and whether your data can tell the difference.
Frequently Asked Questions (FAQ)
1. How much of total web traffic comes from bots?
According to the report, automated bots make up 53% of all web traffic, meaning bots now generate more traffic on the internet than real humans.
2. What is the difference between a "good bot" and a "bad bot"?
- Good Bots: Follow site rules and perform helpful tasks, such as search engine indexing (e.g., Googlebot), monitoring site uptime, or archiving web pages.
- Bad Bots: Designed to exploit websites, steal data, launch attack floods (DDoS), or attempt unauthorized logins using stolen passwords.
3. What percentage of web traffic is malicious?
Roughly 21% of all web traffic comes from bad bots (making up 40% of total bot activity). Good bots account for the remaining 32% of web traffic.
4. What are the most common examples of bad bot attacks?
- Credential Stuffing: Automatically testing stolen passwords to hack user accounts.
- Scraping: Stealing pricing, private content, or sensitive user data in bulk.
- DDoS Attacks: Overloading a website with automated requests to cause server crashes.
- Fraud: Creating fake accounts or submitting fraudulent credit card transactions.
5. Why is it getting harder to tell good bots and bad bots apart?
Some good crawlers can unintentionally strain server resources, while some malicious scrapers actively disguise themselves as real web browsers. Additionally, cybersecurity companies use different criteria to classify bot behavior.
Sources:
Figures were checked in October 2026. Imperva and Cloudflare numbers come from the vendors' announcements and press coverage of their reports; confirm exact values against the original report or Radar before publishing.
- Imperva 2026 Bad Bot Report announcement: over 53% bot traffic, 40% classed as malicious
- Imperva 2025 Bad Bot Report highlights: 51% bot traffic, 37% bad bots
- Imperva report findings (Lenz): 37% malicious and 14% benign split
- TechRadar on the 2025 Imperva report: travel and retail bad bot shares
- Cloudflare reports bots generate majority of web traffic: 57.4% bot share on Radar
- Bots overtake humans in web page requests: metric is HTML page requests
- Web Traffic Statistics Q1 2026: about 31% of all HTTP requests on Radar
- HUMAN Security 2026 State of AI Traffic report: 8x, 187%, 7,851%, 20% scraping
- HUMAN Security press release
- PPC Land on the HUMAN report: 597% scraper growth, 77% product and search pages, 2.3% checkout
- Let's Data Science on agentic traffic: Cloudflare AI Crawl Control and pay-per-crawl